












How to forecast sales for a B2B product business
Three practical ways to forecast B2B product sales: weighted pipeline, run-rate on repeat orders and coverage. With a worked example you can copy.
 By the PromptLab team6 October 20266 min read
For a B2B product business, forecast in two parts. Take the run-rate of repeat orders from existing customers, then add a weighted estimate of the new deals in your pipeline. Check the total against pipeline coverage, and compare it with what actually happened every month so the method improves.
Repeat orders are usually the more reliable part of the number, and new deals are the part that needs judgement. This guide shows how to build each one, with worked examples.
Why product businesses forecast differently
A software company sells a subscription and forecasts renewals. A manufacturer or distributor has two different revenue streams that behave differently:
- Repeat orders. A customer who buys 4 tonnes of a resin every six weeks is predictable until something changes.
- New business. A new account goes through a sample, a test, a quote and a first order. It is lumpy and slower to close.
Treat them as separate lines. Blend them and you hide the one thing a forecast is for: knowing which part of the number is solid and which part depends on a rep's confidence. For the basic idea, see what sales forecasting is.
Method 1: weighted pipeline
Weighted pipeline multiplies each deal's value by the chance it closes, based on its stage, and adds them up.
- 1
Set stage probabilities from your own history
Look at your last two or three quarters. For each stage, count how many deals that reached it went on to win. Those ratios are your stage probabilities. Do not borrow numbers from a blog post, including this one.
- 2
Use the latest quote value, not a guess
Deal value should match the open quote. A deal with no quote is an estimate, so keep it in an early stage.
- 3
Multiply and add up
Value times probability for each deal, summed for the period. Only include deals whose close date falls inside that period.
- 4
Cap the optimism
Review the largest deals one by one. One $200,000 deal at a high probability can swing the whole forecast, so decide on it by judgement, not by formula.
A worked example
Say you sell industrial adhesives, and the quarter has these open deals. The probabilities are examples, not benchmarks: use your own.
| Deal | Stage | Value | Example probability | Weighted value |
|---|---|---|---|---|
| Packaging plant A | Sample sent | $30,000 | 20% | $6,000 |
| Distributor B | Quote sent | $60,000 | 40% | $24,000 |
| Furniture maker C | Negotiation | $45,000 | 60% | $27,000 |
| Builder D | Verbal yes | $25,000 | 85% | $21,250 |
| Total | $160,000 | $78,250 |
The weighted figure is $78,250, not $160,000. In practice you will win some of these in full and lose others completely. The weighted number is the average outcome across many quarters, which is why it suits a team with plenty of deals and misleads a team with three.
Method 2: run-rate on repeat orders
For existing customers, forecast from what they actually buy.
- 1
List repeat customers and their order rhythm
For each, note the average order value and how often they order. A customer who orders $6,000 every six weeks is about $52,000 a year (a year has roughly 8.7 six-week periods).
- 2
Adjust for known changes
A plant shutdown, a price increase, a lost tender or a new product line all change the run-rate. Adjust the line by judgement and write down why.
- 3
Flag customers who are late
If a customer normally orders every six weeks and it has been nine, that order is at risk. This is the earliest warning you will get on churn.
- 4
Add a cautious growth line
Include growth from upselling only where you have a quote or a concrete conversation behind it.
A worked example
Say you have 12 repeat customers, and their combined run-rate comes to $38,000 a month. Two are late and worth $5,000 a month between them. You forecast $33,000 a month from repeat orders for the quarter, which is $99,000, and treat the other $15,000 as upside you will chase.
That method is conservative on purpose. It also tells the team which accounts to call this week.
Method 3: check it with pipeline coverage
Coverage compares open pipeline with the target. If your target for new business is $100,000 and your win rate on qualified pipeline has historically been about one in three, you need roughly $300,000 in the pipeline to have a fair chance. That is a ratio of 3 to 1 for that win rate; work out yours.
Pipeline coverage calculator
Coverage ratio
2.6x
Open pipeline ÷ remaining target
Remaining target
$350,000
Pipeline you need
$1,400,000
Remaining target ÷ 25% win rate
Gap
$500,000
More pipeline to build
Coverage is a reality check on the weighted number. If the weighted pipeline looks fine but coverage is thin, the forecast is relying on a few deals. For the metric itself, read what pipeline coverage is and what win rate is.
You can also estimate how fast pipeline turns into revenue with sales velocity, which combines the number of deals, average value, win rate and cycle length.
Sales velocity calculator
Sales velocity
$2,000/day
Opportunities × deal value × win rate ÷ cycle days
Per month (30 days)
$60,000
Per quarter (90 days)
$180,000
Putting the forecast together
Add the lines and label how sure you are of each.
| Line | Example amount | Confidence |
|---|---|---|
| Repeat orders, run-rate | $99,000 | High |
| Weighted pipeline, this quarter | $78,250 | Medium |
| Early pipeline and new accounts | $0 counted | Upside only |
| Commit | about $177,000 |
Share it as a range, with a floor you are confident in and an upside you would like. Managers who report a single number tend to be wrong in a way that is hard to explain.
Keep the forecast honest
- Compare forecast with actuals every month. Write down the gap and the reason. Within a few quarters you will know your own bias.
- Review the pipeline first. A forecast built on stale deals is fiction. A weekly pipeline review fixes close dates and stages before the numbers are read.
- Use one definition of each stage. If "quote sent" means two things, probabilities mean nothing.
- Do not forecast from gut feel alone. Judgement is useful on the five biggest deals, not on forty small ones.
How PromptLab helps
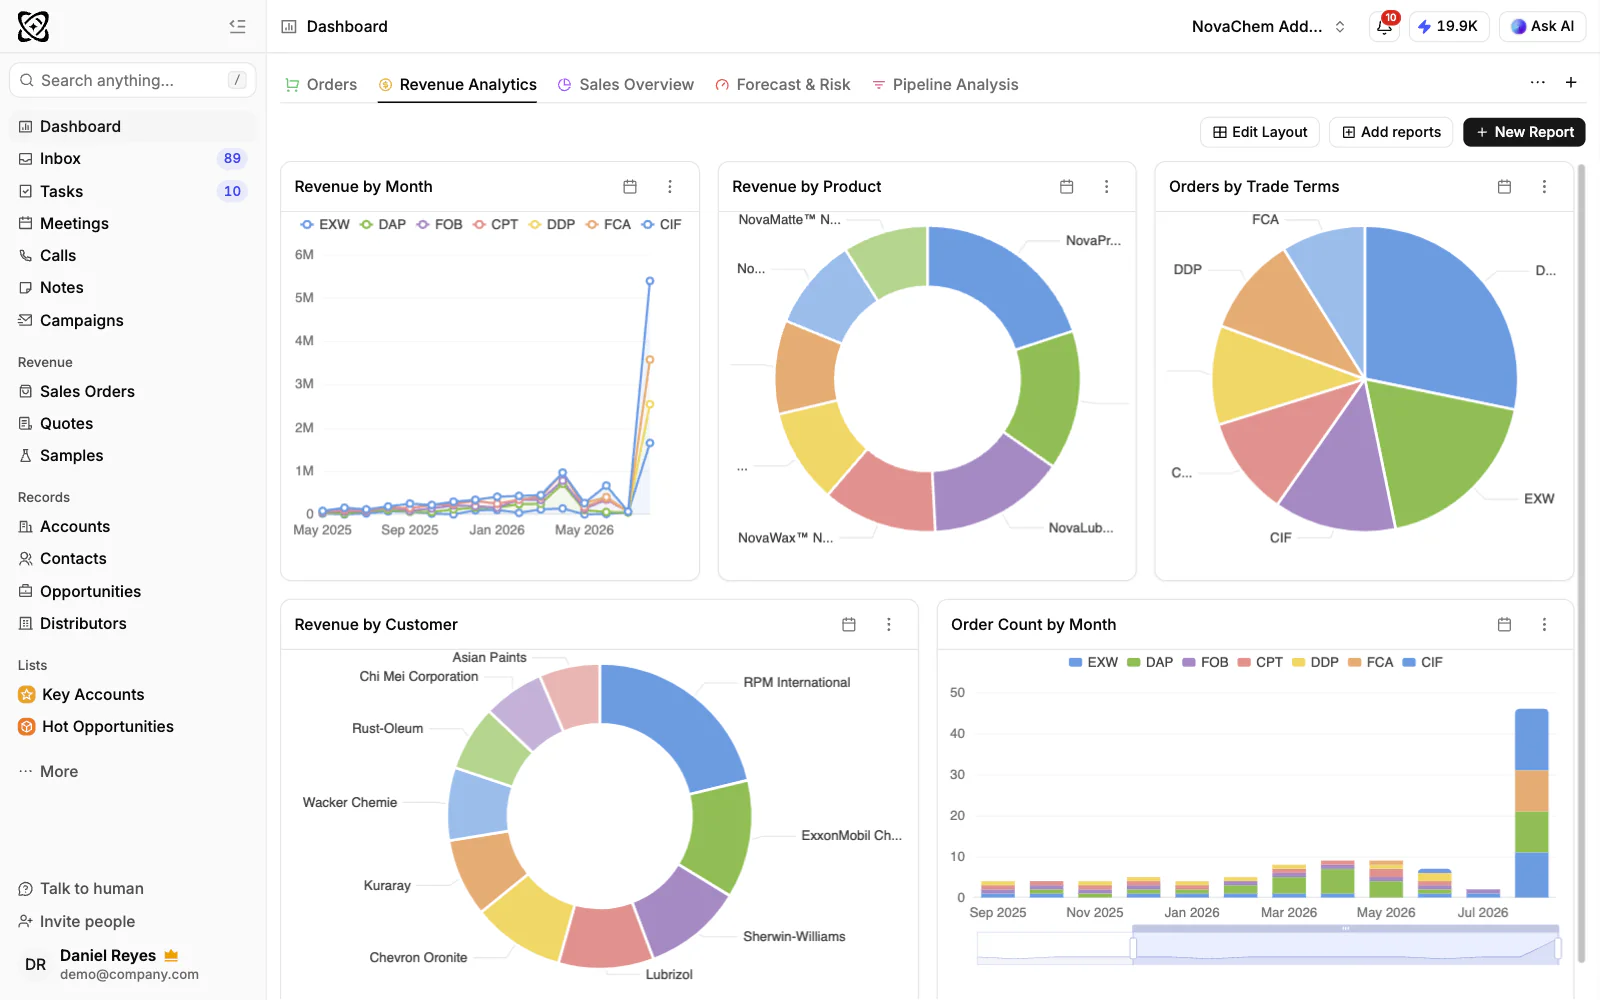
PromptLab gives you reports and dashboards on pipeline and revenue. You can build a report on opportunities by stage and value, and another on sales orders by customer or product, then put both on one dashboard that updates as the CRM does. That is the data for both the weighted pipeline and the repeat-order run-rate. PromptLab does not predict outcomes for you. You set the probabilities from your own history, and the CRM shows you the numbers behind them.
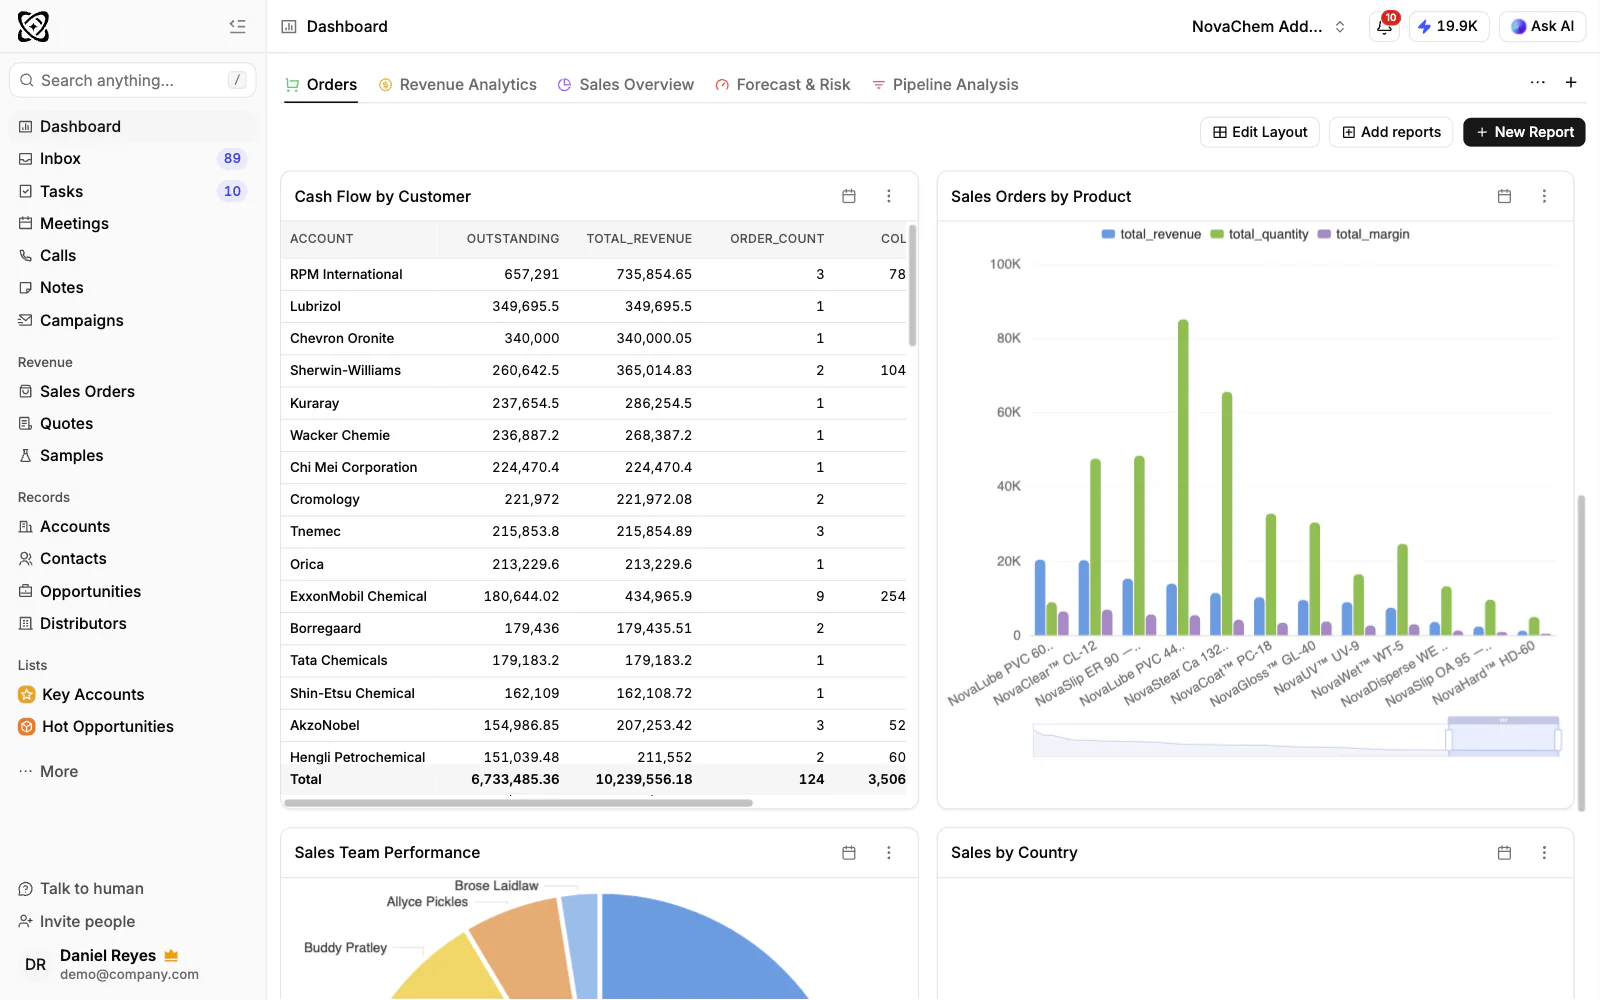
Because quotes, sales orders and customer price lists are on every plan, you can check each deal's value against its latest quote, and repeat orders are recorded as sales orders on the same account. You can also ask in plain words, with Ask AI, how much was ordered by a customer, then check the answer against the report.
Frequently asked questions
What is the simplest way to forecast B2B sales?
Add the run-rate of your repeat customers to a weighted estimate of your open deals. Use stage probabilities taken from your own win history. It needs a CRM with accurate stages and values, and a spreadsheet is enough to do the sums.
How accurate should a sales forecast be?
There is no universal number. Track the gap between forecast and actual each month and aim to shrink it. A forecast that is consistently 10% high is more useful than one that is sometimes right, because you can correct a known bias.
How do you forecast repeat orders?
List each repeat customer's average order value and how often they buy, then multiply out for the period. Flag any customer who is later than usual, because that is the earliest sign of lost business.
Can a CRM forecast sales automatically?
A CRM can total your pipeline and orders and show them on a dashboard, which does most of the work. PromptLab provides reports and dashboards on pipeline and revenue. The probabilities and the judgement on large deals still come from you.
How often should you update the forecast?
Weekly, after the pipeline review, with a fuller look at month end. Update the commit only when something concrete changes, such as a signed quote or a lost deal.