


















How to measure distributor performance
Measure distributors on orders, growth, reach, activity, price discipline and payment: which numbers to track, how to set fair targets and run the review.
 By the PromptLab team7 November 20266 min read
To measure distributor performance, track results (orders and revenue), reach (active customers and products), activity (deals, samples, quotes) and conduct (price discipline, payment, reporting) for each distributor, against a target you agreed at the start of the year. Revenue alone tells you what happened. The activity numbers tell you what will happen next quarter.
This guide is for a manufacturer with several distributors who wants a fair, repeatable way to compare them and decide where to put effort. For the review itself, see how to manage distributor relationships.
Why revenue is not enough
A distributor's revenue can look healthy while the relationship decays. One large customer places a big order and the quarter looks fine. Meanwhile no new customers have been added, no samples have shipped and the only technical rep has left. Revenue is a lagging number. It shows what was sold months ago.
Measure in two groups: what they achieved, and what they are doing that will produce the next result. Review both together.
The eight measures to track
- 1
Orders and revenue against target
The headline. Set a target per distributor for the year, split by quarter, and show actual against it. Use the same currency and the same cut-off date for every distributor.
- 2
Growth on the same period last year
A distributor that is flat in a growing region is losing share. Compare the quarter with the same quarter a year before, to remove seasonality. Say a paint distributor always sells more in spring; this quarter against last quarter would mislead.
- 3
Active customers
Count the end customers who ordered in the last 12 months, and how many are new this year. A distributor with 40 customers and 3 new ones is stable. A distributor with 12 customers, 11 of them old, is exposed.
- 4
Product spread
How many of your products or families the distributor sells. A distributor who buys only your cheapest product is not using the range. Compare against what they could sell in their territory.
- 5
Pipeline activity
Deals opened, samples shipped and quotes sent in the quarter. This is the early signal. A distributor with no quotes this quarter will have few orders next quarter.
- 6
Conversion and reorders
Of the samples shipped, how many became quotes, and of the quotes, how many became orders? Of the first-time buyers, how many reordered? Low conversion points to a product, price or follow-up problem, and each has a different fix.
- 7
Price discipline
Do they sell at the agreed price level, or discount heavily into your other channels? Check quotes against the list. Heavy off-list discounting erodes your price in the market.
- 8
Payment and reporting
Do they pay on time, and do they send the sell-out or customer data you agreed? A distributor who is 45 days late on net 30 is costing you cash. One who never shares customer data leaves you blind.
Set targets that are fair
Agree targets with the distributor, not for them. A target they helped set is one they will try to meet. Use three ingredients: last year's result, the size of their territory and the capacity of their team.
Give two levels, a floor and a stretch. For example, a floor of last year plus 5 percent and a stretch of last year plus 15 percent. Those figures are only an illustration. Pick numbers that fit your market.
Tier distributors by size, and compare like with like. A small distributor measured against a national partner will always look weak, and will stop trying.
Build a simple scorecard
A one-page scorecard per distributor, updated monthly, is enough. Use the same layout for each.
| Measure | Target | Actual | Status |
|---|---|---|---|
| Orders this quarter | Set per distributor | From your orders | Green, amber, red |
| Active customers (12 months) | Set per distributor | Count | Green, amber, red |
| New customers this year | Set per distributor | Count | Green, amber, red |
| Quotes sent | Set per distributor | Count | Green, amber, red |
| Samples shipped | Set per distributor | Count | Green, amber, red |
| Days late on payment | 0 | Average | Green, amber, red |
Decide in advance what green, amber and red mean. Red on activity with green on revenue is the warning case.
Run the review
Share the scorecard with the distributor before the review, not during it. Start with what is going well. Then take the two or three reds and ask what is behind each. Agree actions, owners and dates. A distributor who sees the numbers monthly is never surprised by the quarterly review.
Be fair about what you control. If a distributor's quotes fail because your lead time is eight weeks, the fix is yours. A scorecard that blames them for your problems will lose their trust.
What to do with the results
- Strong across the board: give them more. New products, joint marketing, a bigger territory.
- Strong on revenue, weak on activity: a complacency risk. Ask about team changes and what keeps the pipeline full.
- Weak on revenue, strong on activity: their pipeline is filling. Be patient, and remove what is slowing conversion.
- Weak on both: a hard conversation, a recovery plan with a date, and a fallback.
How PromptLab helps
In PromptLab, a distributor is an account, and the deals, quotes, samples and sales orders linked to it give you the raw counts for the scorecard. Reports and dashboards on pipeline and revenue let you build a view per distributor or a comparison across all of them. Custom fields on the account hold the target and the tier. Filter a report to one distributor and set its target as a line on the chart, so actual against target is one look. For a distributor that orders, the account Overview shows lifetime sales, the last order, the outstanding balance and how many days it takes to pay, which covers the payment measure.
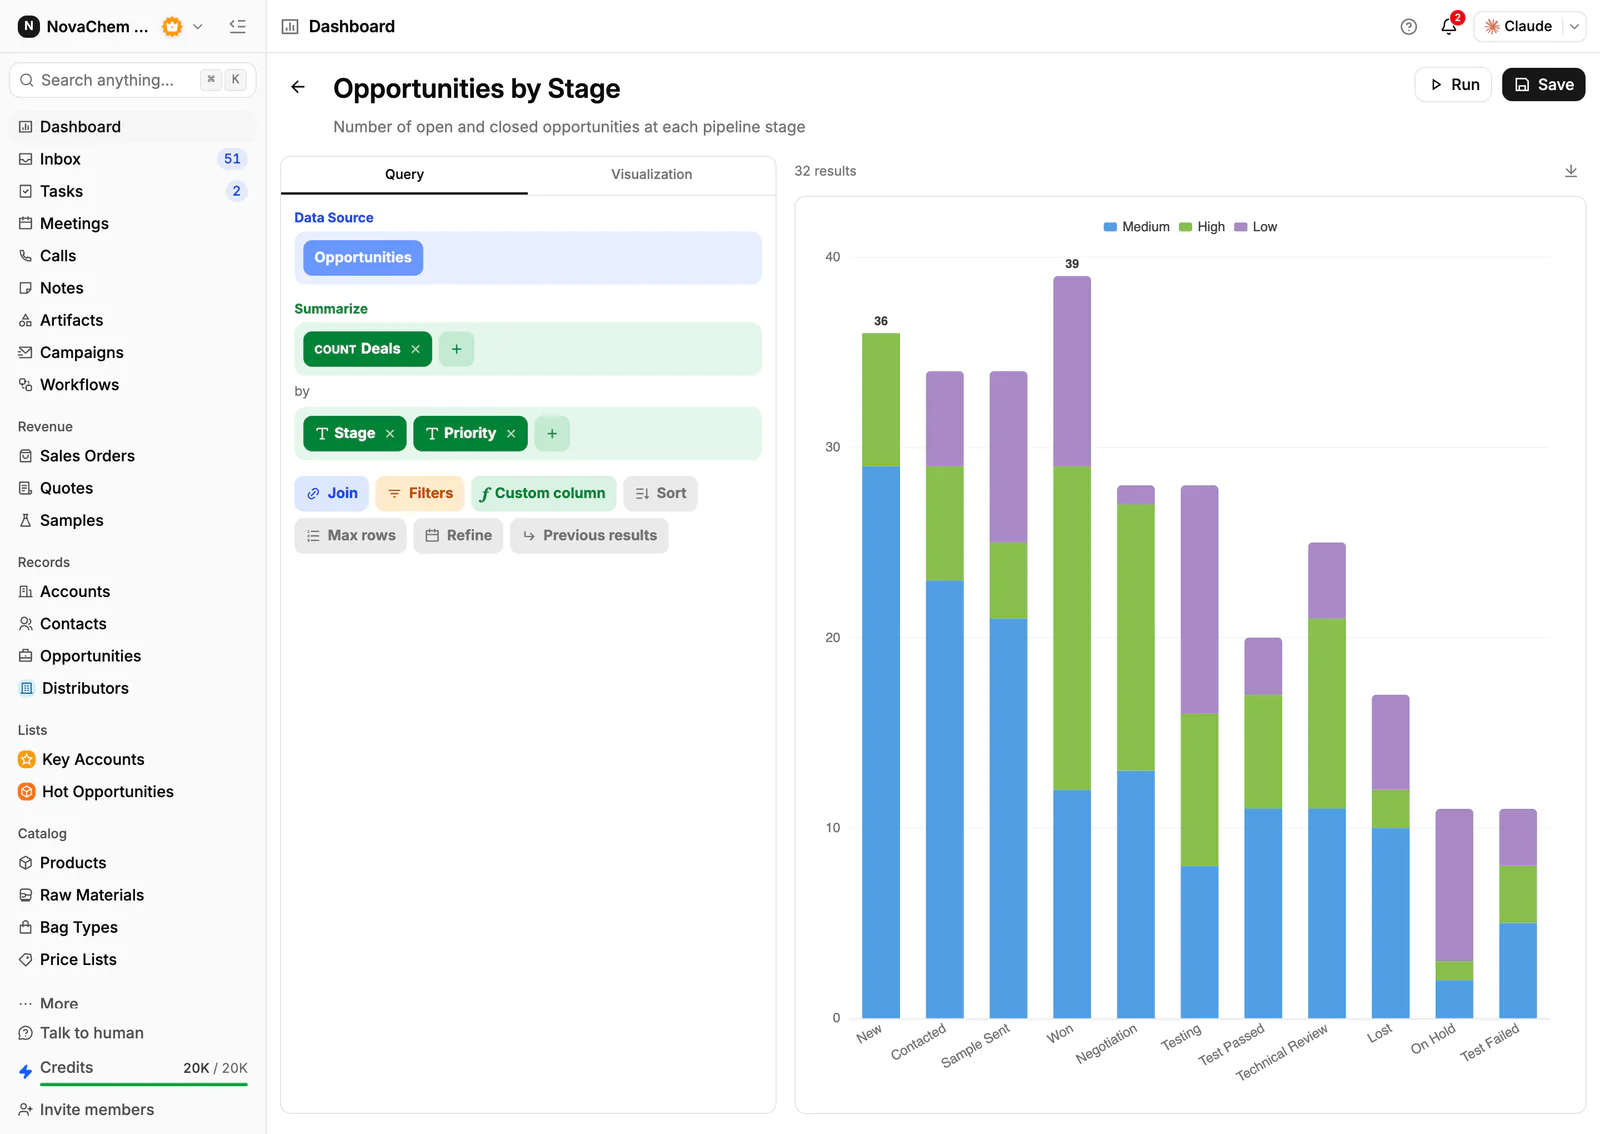
Deals also have a Source field with a Distributor Referral option, so you can see what the channel brings in. Read how to build a sales report for the steps, and how to turn samples into orders for the conversion side. When you need to run a formal review, use the distributor performance review checklist.
Frequently asked questions
What are the key metrics for distributor performance?
Orders and revenue against target, growth on last year, active and new customers, product spread, pipeline activity (deals, samples, quotes), conversion and reorders, price discipline, and payment and reporting. Track results and activity together.
How often should I review distributor performance?
Look at the scorecard monthly and hold a full review quarterly. A monthly look catches problems while they are small, and the quarterly review is where you agree actions for the next period.
How do I set distributor sales targets?
Start with last year's result, adjust for territory size and team capacity, and agree the target with the distributor. Set a floor and a stretch, so a good result is recognised and a minimum is clear.
What if a distributor will not share customer data?
Make it a condition of the agreement from the start. If it is not, explain what you will do with it: spotting demand, planning stock and supporting their customers. You can still measure from your own side, such as orders, quotes and samples.
How do I compare a small distributor with a large one?
Group them by tier and compare within the tier, and compare each against its own target and growth. Raw revenue across different sizes is unfair and demotivating.