


















How to build a sales report
How to build a sales report for a B2B product team: pick the question, choose the data, group it, add a comparison and share it so someone acts on it.
 By the PromptLab team6 November 20265 min read
To build a sales report, start with one question, pick the data that answers it, group and filter it, add a comparison, and send it to the person who can act. A good report is one page and ends with a decision: "Quotes older than 14 days with no answer: chase these six."
This guide is for a sales lead at a manufacturer or distributor who wants reports the team reads. If you want the weekly screen rather than a one-off cut, see how to build a sales dashboard.
Start with the question, not the data
Most bad reports start with "what can the system show?" Good ones start with "what do we need to decide?" Examples for a product business:
- Which product lines are growing, and which are falling?
- Which customers ordered last year and have gone quiet?
- Where do deals stall between sample and quote?
- Which rep has the most open quotes with no answer?
- Why did we lose deals this quarter?
Write the question as the report's title. If you cannot, the report is not ready to build.
Step by step: build the report
- 1
Name the question and the reader
"Which quotes need chasing?" for the sales manager is a different report from "How did Q3 go?" for the director. Decide who reads it and what they will do after.
- 2
Choose what to count
Pick one measure: number of deals, deal value, number of quotes, order value or samples sent. Keep one measure per report. Mixed measures make a report hard to read.
- 3
Group it
Decide how to slice it: by month, rep, product, stage, customer or loss reason. One grouping makes a clear chart; two make a table.
- 4
Filter to what matters
Set a date range, drop test records and leave out what is not relevant. "Open deals above $5,000 created this quarter" is sharper than "all deals".
- 5
Add a comparison
A number alone says little. Compare with last month, last year or a target. "$410,000 won, target $600,000" is something a manager can act on.
- 6
Check the data behind it
Read five records by hand. Do values look right? Are lost deals carrying a reason? If the field is empty, the report is fiction. Fix the habit, then re-run it.
- 7
Pick the chart, then share it
Use a bar for comparing groups, a line for change over time, a number for one total and a table for lists to act on. Send it to the reader, with one sentence on what to look at.
Reports worth building first
- Pipeline by stage. Where the money sits.
- Won revenue by month. Direction of travel.
- Revenue by product line. What sells.
- Quotes out and unanswered. The follow-up list.
- Lost deals by reason. Why you lose: price, competitor, timing, budget or product fit.
- Repeat against new customers. How much comes from existing buyers.
Say a plastics supplier runs report 4 every Monday. It shows nine quotes sent more than two weeks ago with no answer, worth $62,000 in total. The manager gives each rep the list. That one page does more than a monthly slide deck.
Mistakes to avoid
- Reports with no reader. If no one is named, no one reads it.
- Too many measures on one page. Split it.
- No definition of "won". Agree whether you count deals closed or sales orders raised, and do not switch.
- Reporting on empty fields. A loss-reason report is useless if half the lost deals say nothing.
- Sending it once. If you will need it again, save it and put it on a dashboard. See how to share a sales dashboard.
For what to do with the numbers, see how to forecast sales and how to run a pipeline review.
A worked example: the lost-deals report
Say you suspect you are losing on price. Question: "Why did we lose deals this quarter?" Measure: number of lost deals. Group by loss reason. Filter to the last three months. Compare with the quarter before. The result shows Price in first place, with Timing second. Now you can ask the useful question: is the price gap on one product line, or across the range? Add a second report grouped by product, and you have a pricing review instead of an opinion.
Start small, with one report that changes one decision, and add more only when someone asks.
How PromptLab helps
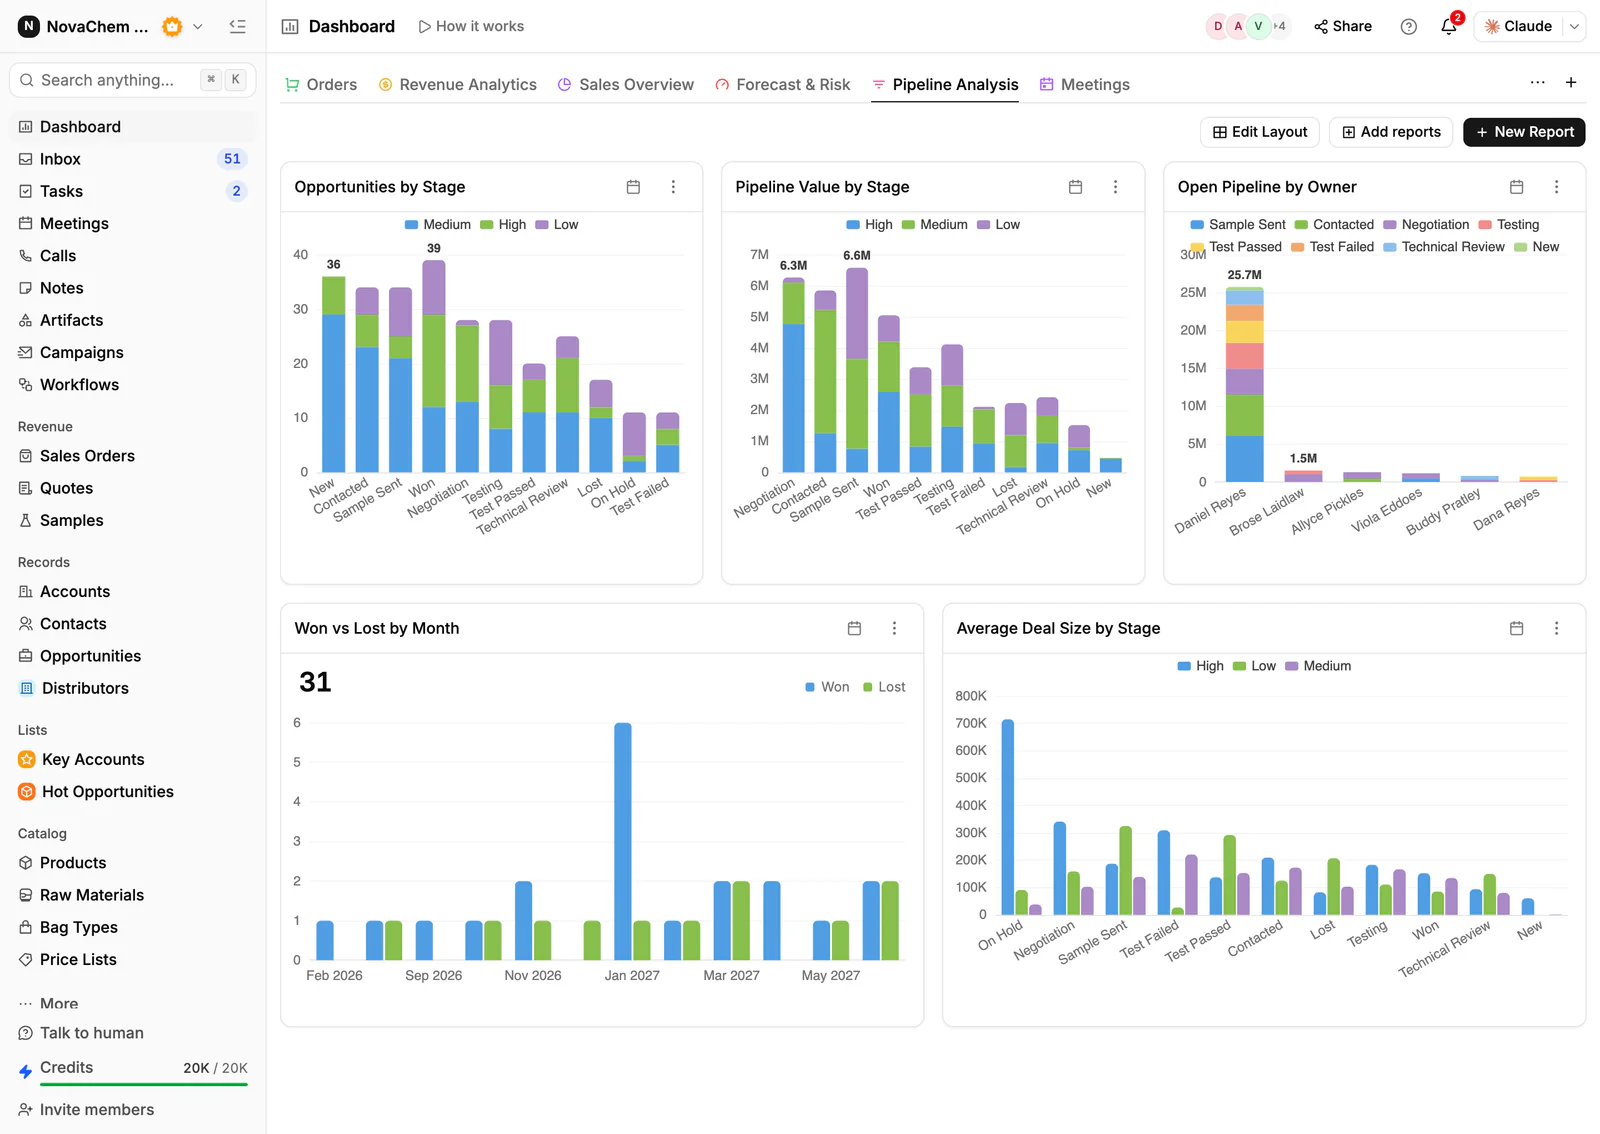
PromptLab has reports and dashboards on pipeline and revenue, and a report builder where you choose what to count, how to group it and how to filter it. Deals, quotes, sales orders and samples are in the same system, so one report can look at pipeline and orders without an export. Lost deals carry a loss reason from a fixed list, so a loss-reason report works from day one.
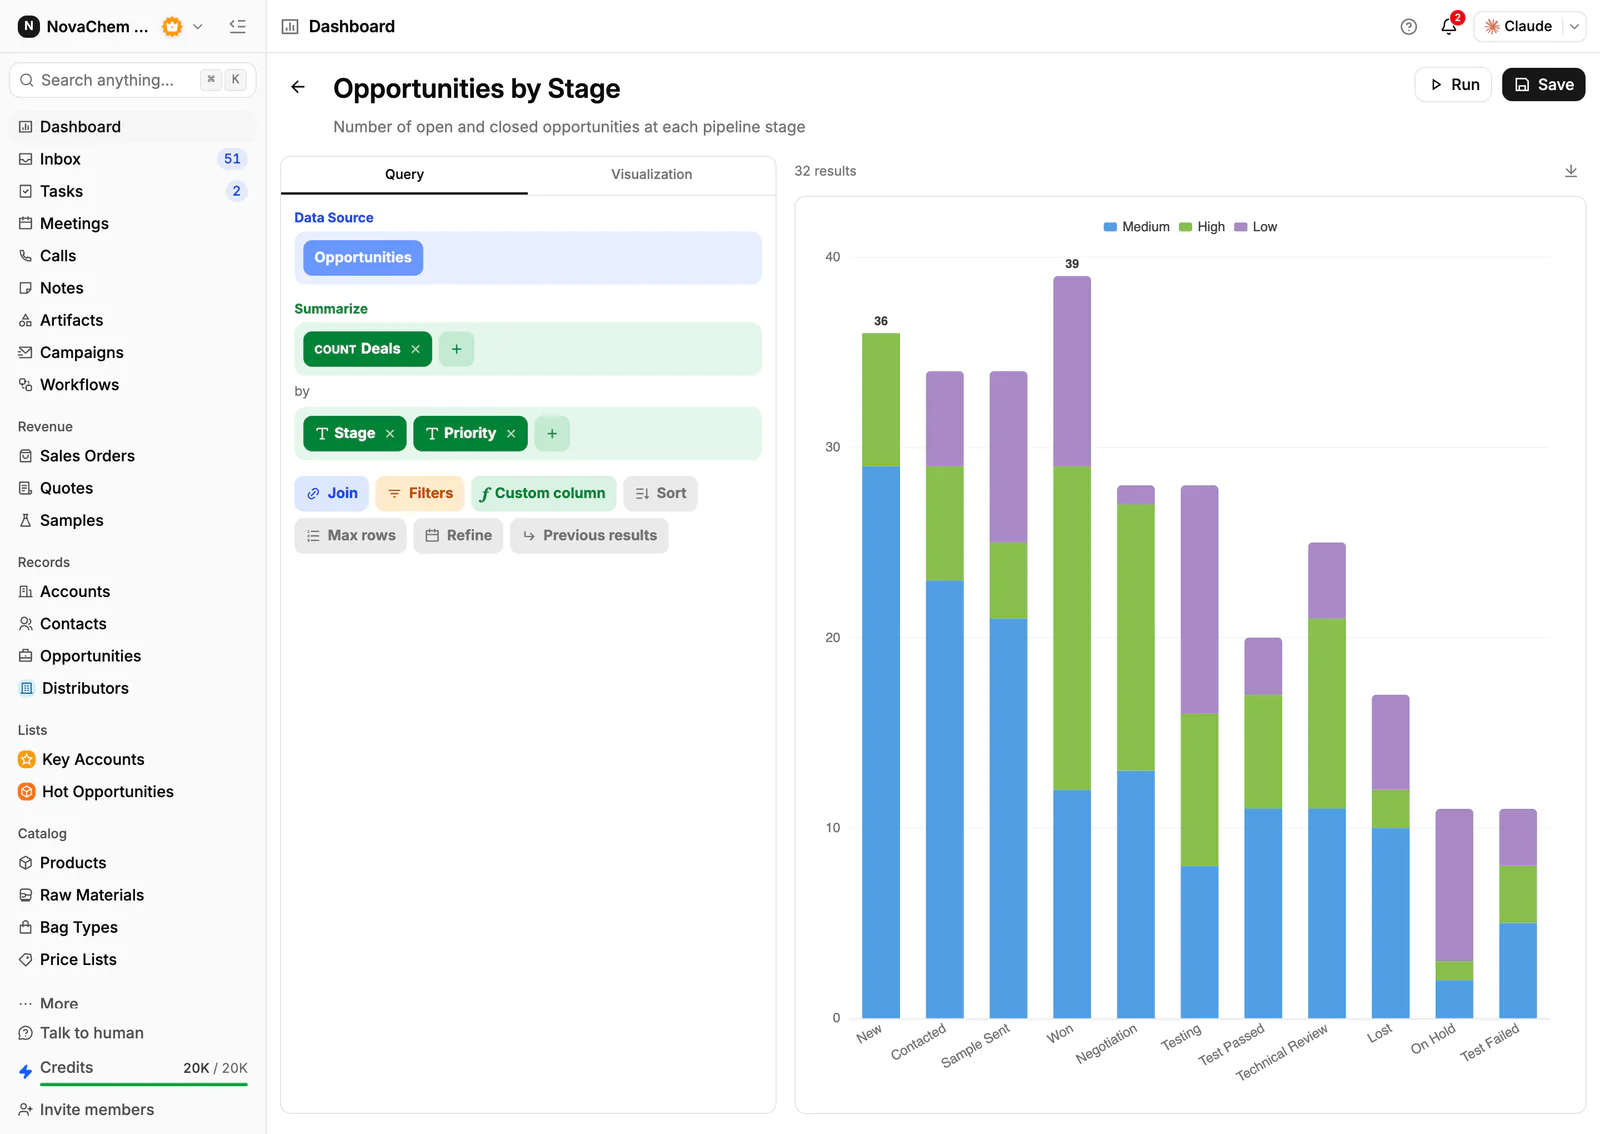
You can share a report or dashboard by a read-only link that needs no login, with an optional expiry. If you would rather not build one, Ask AI answers a plain-words question about deals, quotes and sales orders.
Frequently asked questions
What should a sales report include?
One question, one measure, a grouping, a date range and a comparison with a target or earlier period. Add a short note on what to do. Anything else belongs in another report.
How often should you send a sales report?
Weekly for pipeline and quote follow-up, monthly for revenue and product mix, quarterly for loss reasons and customer trends. Match the rhythm to how fast the decision is made.
What is the difference between a sales report and a dashboard?
A report answers a question, usually once. A dashboard shows a few key reports on one screen so you can watch them change. Build the report first and add it to a dashboard when you need it again.
What sales metrics matter for a product business?
Pipeline by stage, won revenue, revenue by product, win rate, quotes unanswered, lost deals by reason and repeat against new customers. Samples sent matter if samples come before quotes.
Can I build sales reports without a developer?
Yes, in a CRM with a report builder. In PromptLab you choose the data, grouping and filters, and save the report. Dashboards and share links are built in.